

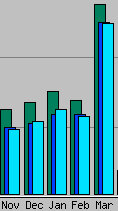
NEW YORK, NY– A new year often brings resolutions and hopes for a new beginning. This year for many Americans the new year seems to have also brought a renewed sense of optimism towards the President, the direction of the country and, to a lesser degree, even Congress. When asked to rate the overall job President Obama is doing, over two in five Americans (44%) give him positive ratings and just over half (56%) give him negative marks. This is better than in December when just 36% gave the President positive marks and 64% gave him negative ratings.
These are some of the results of The Harris Poll of 2,566 adults surveyed online between January 17 and 24, 2011 by Harris Interactive. Please note this survey was conducted before President Obama delivered his State of the Union address.
There are some interesting differences in the President’s job ratings. Easterners and Southerners are the most differing in their views with those in the East being split down the middle as half give him positive ratings (50%) and half give him negative marks (50%). Southerners, on the other hand, are still most negative as 60% give the President negative ratings. There is also an educational difference with three in five of those with a high school or less education (61%) giving the President negative marks on his job while three in five of those with a post graduate degree (62%) give him positive ratings.
With the new Congress now sworn in, there is a small uptick in their ratings as well. Last month 11% gave them positive ratings while 89% gave Congress negative marks. This month 16% of Americans give Congress positive ratings and 84% give them negative ones. Interestingly, Republicans may now have control of one chamber, but that isn’t positively affecting Republicans’ views. Just 8% of Republicans give Congress positive ratings compared to 10% of Independents and 25% of Democrats.
There is also some optimism in the way the country is going. Almost two in five Americans (37%) now say it is going in the right direction while 63% say it is going off on the wrong track. Last month, less than three in ten (29%) said things were going in the right direction and 71% believed they were going off on the wrong track.
When it comes to the issues that the government needs to address, over one-third of Americans (35%) say health care, the first time this has popped to the top of the list in months. However, the rest of the top five all make it clear one thing is still on the minds of Americans—the economy. On the list of the most important issues, after health care is employment/jobs (33%), the economy (24%), budget/government spending issues (13%), and national debt/deficit (12%).
So What?
Americans seem to be more positive and the question now becomes how the State of the Union address changes things. President Obama is now at his highest approval ratings since October, 2009 and even Congress is at their “highest” point since April of last year. This may be the start of things turning around, but one month does not a trend make.
TABLE 1
PRESIDENT OBAMA’S JOB RATING – TREND
“How would you rate the overall job President Barack Obama is doing?”
Base: All adults
| 2009 | ||||||||||
| Mar | April | May | June | Aug | Sept | Oct | Nov | Dec | ||
| % | % | % | % | % | % | % | % | % | ||
| POSITIVE | 55 | 58 | 59 | 54 | 51 | 49 | 45 | 43 | 41 | |
| Excellent | 17 | 18 | 17 | 14 | 11 | 11 | 10 | 9 | 7 | |
| Pretty good | 38 | 40 | 42 | 39 | 39 | 38 | 35 | 33 | 33 | |
| NEGATIVE | 45 | 42 | 41 | 46 | 49 | 51 | 55 | 57 | 59 | |
| Only fair | 27 | 26 | 25 | 25 | 25 | 25 | 27 | 29 | 30 | |
| Poor | 18 | 15 | 16 | 21 | 24 | 26 | 28 | 29 | 30 | |
| 2010 | 2011 | |||||||||||
| Jan | Mar | April | May | June | Aug | Sept | Oct | Nov | Dec | Jan | ||
| % | % | % | % | % | % | % | % | % | % | % | ||
| POSITIVE | 40 | 41 | 41 | 42 | 39 | 40 | 38 | 37 | 38 | 36 | 44 | |
| Excellent | 9 | 9 | 9 | 10 | 6 | 9 | 9 | 8 | 8 | 7 | 10 | |
| Pretty good | 31 | 32 | 31 | 32 | 33 | 31 | 29 | 29 | 30 | 28 | 34 | |
| NEGATIVE | 60 | 59 | 59 | 58 | 61 | 60 | 62 | 63 | 62 | 64 | 56 | |
| Only fair | 30 | 28 | 26 | 28 | 29 | 26 | 28 | 30 | 29 | 31 | 28 | |
| Poor | 30 | 31 | 33 | 30 | 32 | 34 | 34 | 33 | 33 | 34 | 29 | |
Note: Percentages may not add up to 100% due to rounding
TABLE 2
PRESIDENT OBAMA’S JOB RATING – BY PARTY & IDEOLOGY
“How would you rate the overall job President Barack Obama is doing?”
Base: All adults
| Total | Political party | Political Philosophy | ||||||
| Rep. | Dem. | Ind. | Cons. | Mod. | Lib. | |||
| % | % | % | % | % | % | % | ||
| POSITIVE | 44 | 8 | 78 | 36 | 14 | 49 | 77 | |
| Excellent | 10 | 3 | 20 | 5 | 2 | 8 | 24 | |
| Pretty good | 34 | 5 | 58 | 31 | 11 | 41 | 52 | |
| NEGATIVE | 56 | 92 | 22 | 64 | 86 | 51 | 23 | |
| Only fair | 28 | 32 | 17 | 33 | 30 | 31 | 17 | |
| Poor | 29 | 59 | 5 | 31 | 56 | 20 | 6 | |
Note: Percentages may not add up to 100% due to rounding
TABLE 3
PRESIDENT OBAMA’S JOB RATING – BY REGION, EDUCATION & GENDER
“How would you rate the overall job President Barack Obama is doing?”
Base: All adults
| Total | Region | Education | Gender | |||||||||
| East | Midwest | South | West | H.S. or less | Some college | College grad | Post grad | Men | Women | |||
| % | % | % | % | % | % | % | % | % | % | % | ||
| POSITIVE | 44 | 50 | 44 | 40 | 44 | 39 | 43 | 48 | 62 | 42 | 45 | |
| Excellent | 10 | 15 | 6 | 9 | 9 | 10 | 8 | 9 | 15 | 13 | 7 | |
| Pretty good | 34 | 35 | 37 | 31 | 35 | 29 | 35 | 39 | 47 | 30 | 38 | |
| NEGATIVE | 56 | 50 | 56 | 60 | 56 | 61 | 57 | 52 | 38 | 58 | 55 | |
| Only fair | 28 | 28 | 30 | 27 | 26 | 30 | 29 | 25 | 20 | 25 | 30 | |
| Poor | 29 | 22 | 27 | 33 | 29 | 31 | 29 | 28 | 18 | 33 | 24 | |
Note: Percentages may not add up to 100% due to rounding
TABLE 4
CONGRESS’ OVERALL JOB RATING
“How would you rate the overall job Congress is doing?”
Base: All adults
| Total | Political Party | ||||
| Rep. | Dem. | Ind. | |||
| % | % | % | % | ||
| POSITIVE | 16 | 8 | 25 | 10 | |
| Excellent | 3 | 1 | 7 | 2 | |
| Pretty good | 12 | 7 | 19 | 8 | |
| NEGATIVE | 84 | 92 | 75 | 90 | |
| Only fair | 46 | 43 | 52 | 39 | |
| Poor | 38 | 48 | 23 | 51 | |
Note: Percentages may not add up to 100% due to rounding
TABLE 5
CONGRESS’ OVERALL JOB RATING – TREND
“How would you rate the overall job the Congress is doing?”
Base: All adults
| TREND | Positive* | Negative** | ||
| % | % | |||
| 2011 | January | 16 | 84 | |
| 2010 | December | 11 | 89 | |
| November | 13 | 87 | ||
| October | 11 | 89 | ||
| September | 13 | 87 | ||
| August | 15 | 85 | ||
| June | 14 | 86 | ||
| May | 15 | 85 | ||
| April | 16 | 84 | ||
| March | 10 | 90 | ||
| Jan. | 16 | 84 | ||
| 2009 | Dec. | 17 | 83 | |
| Oct. | 16 | 84 | ||
| Sept. | 19 | 81 | ||
| Aug. | 22 | 78 | ||
| June | 25 | 75 | ||
| March | 29 | 71 | ||
| 2008 | October | 10 | 86 | |
| August | 18 | 77 | ||
| June | 13 | 83 | ||
| February | 20 | 76 | ||
| 2007 | December | 17 | 79 | |
| October | 20 | 77 | ||
| April | 27 | 69 | ||
| February | 33 | 62 | ||
| 2006 | September | 24 | 73 | |
| May | 18 | 80 | ||
| February | 25 | 71 | ||
| January | 25 | 72 | ||
*Positive = excellent or pretty good. **Negative = only fair or poor.
Note: Prior to March, 2009, this question was asked by telephone.
TABLE 6
RIGHT DIRECTION OR WRONG TRACK
“Generally speaking, would you say things in the country are going in the right direction or have they pretty seriously gotten off on the wrong track?”
Base: All adults
| TREND | Right Direction | Wrong Track | ||
| % | % | |||
| 2011 | January | 37 | 63 | |
| 2010 | December | 29 | 71 | |
| November | 33 | 67 | ||
| October | 34 | 66 | ||
| September | 36 | 64 | ||
| June | 34 | 66 | ||
| April | 39 | 61 | ||
| March | 33 | 67 | ||
| 2009 | August | 46 | 54 | |
| January | 19 | 72 | ||
| 2008 | October | 11 | 83 | |
| February | 23 | 69 | ||
| 2007 | December | 18 | 74 | |
| February | 29 | 62 | ||
| 2006 | May | 24 | 69 | |
| February | 32 | 59 | ||
| 2005 | November | 27 | 68 | |
| January | 46 | 48 | ||
| 2004 | September | 38 | 57 | |
| June | 35 | 59 | ||
| 2003 | December | 35 | 57 | |
| June | 44 | 51 | ||
| 2002 | December | 36 | 57 | |
| June | 46 | 48 | ||
| 2001 | December | 65 | 32 | |
| June | 43 | 52 | ||
| 2000 | October | 50 | 41 | |
| June | 40 | 51 | ||
| 1999 | June | 37 | 55 | |
| March | 47 | 45 | ||
| 1998 | December | 43 | 51 | |
| June | 48 | 44 | ||
| 1997 | December | 39 | 56 | |
| April | 36 | 55 | ||
| 1996 | December | 38 | 50 | |
| June | 29 | 64 | ||
| 1995 | December | 26 | 62 | |
| June | 24 | 65 | ||
| 1994 | December | 29 | 63 | |
| June | 28 | 65 | ||
| 1993 | June | 21 | 70 | |
| March | 39 | 50 | ||
| 1992 | June | 12 | 81 | |
| January | 20 | 75 | ||
| 1991 | December | 17 | 75 | |
| January | 58 | 32 | ||
Note: Prior to March, 2009 this question was asked via telephone
TABLE 7
MOST IMPORTANT ISSUE
“What do you think are the two most important issues for the government to address?”
Spontaneous, unprompted replies
Base: All adults
| ’97 | ’98 | ’99 | ’00 | ’01 | ’02 | ’03 | ’04 | ’05 | ’06 | 07 | 08 | 09 | 09 | 10 | 10 | 10 | 10 | 10 | ’11 | ||
| May | Jan | Feb | Aug | Dec | Dec | June | Oct | Aug | June | Oct | Oct | Mar | Nov | Jan | Apr | June | Sept | Nov | Jan | ||
| % | % | % | % | % | % | % | % | % | % | % | % | % | % | % | % | % | % | % | % | ||
| Healthcare (not Medicare) | 10 | 11 | 12 | 15 | 5 | 10 | 14 | 18 | 11 | 12 | 25 | 22 | 25 | 47 | 45 | 34 | 23 | 24 | 30 | 35 | |
| Employment/jobs | 5 | 3 | 4 | 4 | 7 | 8 | 8 | 10 | 3 | 7 | 5 | 5 | 21 | 24 | 31 | 34 | 28 | 37 | 36 | 33 | |
| The economy (non-specific) | 8 | 9 | 7 | 5 | 32 | 34 | 25 | 28 | 19 | 14 | 13 | 64 | 50 | 34 | 32 | 27 | 28 | 34 | 33 | 24 | |
| Budget/Government spending | X | X | X | X | X | X | X | X | X | 5 | 6 | 2 | 6 | 11 | 7 | 9 | 10 | 11 | 10 | 13 | |
| Budget deficit/National debt | X | X | X | X | X | X | X | X | X | X | X | X | 3 | X | X | 8 | 8 | 6 | 8 | 12 | |
| Immigration | 2 | 1 | * | 1 | 1 | 1 | 2 | 2 | 3 | 20 | 12 | 3 | 4 | 5 | 5 | 7 | 12 | 10 | 8 | 8 | |
| Education | 15 | 14 | 21 | 25 | 12 | 11 | 13 | 7 | 8 | 7 | 6 | 6 | 5 | 5 | 5 | 6 | 6 | 6 | 6 | 7 | |
| Taxes | 14 | 16 | 12 | 13 | 6 | 5 | 11 | 8 | 5 | 4 | 3 | 6 | 4 | 4 | 4 | 7 | 4 | 7 | 7 | 6 | |
| Social security | 6 | 6 | 24 | 16 | 3 | 2 | 4 | 4 | 10 | 5 | 3 | 3 | 1 | 2 | 1 | 2 | 2 | 2 | 4 | 3 | |
| (The) war | X | X | X | X | 12 | 18 | 8 | 35 | 41 | 27 | 24 | 14 | 9 | 9 | 2 | 6 | 6 | 4 | 4 | 3 | |
| (Programs for) the poor/ poverty | 3 | 2 | 2 | 3 | 1 | 2 | 3 | * | 4 | 4 | 4 | * | 1 | 2 | 2 | 1 | 1 | 2 | 2 | 3 | |
| Environment | 3 | 2 | 3 | 3 | 1 | 3 | 2 | 1 | 3 | 3 | 3 | 2 | 3 | 4 | 3 | 3 | 7 | 3 | 2 | 2 | |
| Terrorism | X | X | X | X | 22 | 17 | 11 | 7 | 7 | 4 | 4 | 3 | 4 | 3 | 6 | 2 | 3 | 2 | 2 | 2 | |
| Downsizing government | X | X | X | 1 | * | X | X | 1 | * | 1 | 1 | * | 1 | 2 | 2 | 3 | 2 | 2 | 2 | 2 | |
| Housing | X | X | X | X | X | 1 | 1 | * | * | 1 | 2 | 2 | 6 | 1 | 1 | 1 | 1 | 2 | 1 | 2 | |
| Energy | X | X | X | X | X | X | 1 | 1 | 4 | 4 | 1 | 4 | 3 | 1 | 1 | 2 | 5 | 1 | 1 | 1 | |
| Foreign policy (non-specific) | 3 | 5 | 4 | 3 | 2 | 4 | 2 | 3 | 2 | 2 | 4 | 2 | 3 | 2 | 2 | 2 | 2 | 2 | 2 | 1 | |
| Homeland/domestic security/public safety | X | X | X | X | 8 | 9 | 3 | 6 | 2 | 2 | 2 | 1 | 2 | 1 | 1 | 1 | 1 | 1 | 1 | 1 | |
| Inflation | X | X | X | X | X | X | X | X | 1 | 2 | 3 | * | 1 | 1 | * | * | * | * | 1 | 1 | |
| Bipartisanship | X | X | X | X | X | X | X | X | X | X | X | X | X | X | X | X | X | X | X | 1 | |
| Medicare | 4 | 5 | 5 | 6 | 1 | 1 | 4 | 3 | 2 | 1 | 3 | 2 | * | * | * | * | * | * | 2 | 1 | |
| Gas and oil prices | X | X | X | X | X | X | 1 | 1 | 10 | 8 | 2 | 1 | 1 | 1 | * | 1 | * | 1 | 1 | 1 | |
| Crime/violence | 19 | 13 | 8 | 10 | 1 | 2 | 3 | 1 | 3 | 2 | 2 | 1 | * | 1 | 1 | 1 | * | 1 | * | 1 | |
| Afghanistan | X | X | X | X | X | X | X | X | X | X | X | X | X | X | X | X | X | 2 | * | 1 | |
| Welfare | 14 | 8 | 4 | 2 | 1 | 1 | 3 | * | 3 | 1 | 2 | * | * | 1 | * | 1 | 1 | 1 | 1 | 1 | |
| Regulating banking/financial services | X | X | X | X | X | X | X | X | X | X | X | * | 8 | 1 | 3 | 4 | 2 | 2 | 1 | 1 | |
| Second Amendment (Right to Bear Arms) | X | X | X | X | X | X | X | X | X | X | X | X | X | X | X | X | X | X | X | 1 | |
| Ethics in government | * | * | * | * | 1 | 1 | 1 | 1 | 1 | 1 | 1 | 1 | 1 | 1 | 1 | 1 | 1 | 2 | 1 | 1 | |
| Human/civil/women’s rights | 2 | 1 | * | 1 | 1 | 1 | * | 1 | 1 | 1 | 2 | * | * | 1 | 1 | * | 1 | 1 | 1 | 1 | |
| Homelessness | 4 | 4 | 3 | 3 | 2 | 2 | 1 | * | 1 | 1 | 3 | * | * | 1 | 1 | * | * | 1 | * | 1 | |
| National security | X | X | 2 | 2 | 6 | 3 | 6 | 5 | 2 | 2 | 2 | 5 | 2 | 1 | 4 | 3 | 2 | 2 | 1 | 1 | |
| Military/defense | 2 | 2 | 2 | 4 | 4 | 1 | 5 | 3 | 1 | 4 | 2 | 2 | 2 | 1 | 1 | 1 | 1 | 1 | 1 | 1 | |
| Business accountability/bailouts | X | X | X | X | X | X | X | X | X | X | X | X | X | X | X | X | X | 2 | 1 | 1 | |
| Income gap/Wealth distribution/Middle class | X | X | X | X | X | X | X | X | X | X | X | X | X | X | X | X | X | X | X | 1 | |
| Religion (decline of) | * | 1 | * | 1 | 2 | 1 | 1 | 1 | * | 1 | 1 | * | * | * | * | 1 | 1 | 1 | 1 | * | |
| Same sex rights | X | X | X | X | X | X | X | 1 | 1 | 2 | * | * | 1 | 1 | 1 | 1 | * | * | 1 | * | |
| Obama/president | X | X | X | X | X | X | X | X | X | X | 1 | * | * | 1 | 1 | 1 | 1 | 1 | 1 | * | |
| Infrastructure | X | X | X | X | X | X | X | X | X | X | X | X | X | X | X | X | X | X | X | * | |
| Abortion | 2 | 2 | 2 | 6 | 1 | 1 | 1 | 4 | 2 | 1 | 2 | 1 | 1 | 1 | 1 | * | * | * | * | * | |
| Programs for the elderly (not Medicare/Social Security) | 1 | 1 | 1 | 2 | 1 | 1 | 3 | * | * | * | 1 | 1 | * | * | * | * | * | * | * | * | |
| Judicial/Legal Issues | X | X | X | X | X | X | X | * | 2 | 1 | 1 | * | 1 | 1 | 1 | 1 | 1 | * | * | * | |
| Iraq | * | * | 1 | X | X | 11 | 3 | 9 | 6 | 8 | 14 | 7 | 2 | 4 | 2 | 2 | 2 | * | 1 | * | |
| Other1 | 8 | 19 | 2 | 19 | 3 | 8 | 8 | 8 | 1 | 6 | 5 | 15 | 5 | 3 | 1 | 3 | 2 | 5 | 6 | 5 | |
| Not sure/refused/no issue | 9 | 12 | 16 | 18 | 11 | 10 | 12 | 9 | 8 | 6 | 8 | 4 | 4 | 3 | 2 | 2 | 4 | 1 | 2 | 4 | |
* = Less than 0.5%, X = Not mentioned as specific issue
1 Including prescription drug prices, credit problems, trade, disability, corporate scandals, right to bear arms, youth and government (other)
Note: Prior to March, 2009, this question was asked via telephone
Methodology
This Harris Poll was conducted online within the United States between January 17 to 24, 2011 among 2,566 adults (aged 18 and over). Figures for age, sex, race/ethnicity, education, region and household income were weighted where necessary to bring them into line with their actual proportions in the population. Propensity score weighting was also used to adjust for respondents’ propensity to be online.
All sample surveys and polls, whether or not they use probability sampling, are subject to multiple sources of error which are most often not possible to quantify or estimate, including sampling error, coverage error, error associated with nonresponse, error associated with question wording and response options, and post-survey weighting and adjustments. Therefore, Harris Interactive avoids the words “margin of error” as they are misleading. All that can be calculated are different possible sampling errors with different probabilities for pure, unweighted, random samples with 100% response rates. These are only theoretical because no published polls come close to this ideal.
Respondents for this survey were selected from among those who have agreed to participate in Harris Interactive surveys. The data have been weighted to reflect the composition of the adult population. Because the sample is based on those who agreed to participate in the Harris Interactive panel, no estimates of theoretical sampling error can be calculated.
These statements conform to the principles of disclosure of the National Council on Public Polls.
Americans More Optimistic on Job of President and Congress added by admin on
View all posts by admin →